Photogrammetry is a technology that uses photographs taken from different angles to measure and map objects in three dimensions. It is used in a variety of industries, including architecture, engineering, surveying, and remote sensing. Photogrammetry combines the use of photography and computer–aided design (CAD) to measure distances, angles, and surface features of objects.Photogrammetry is typically used to create accurate maps and models of objects, buildings, and landscapes.
These maps and models can be used for various purposes, including planning construction projects, conducting surveys, and performing aerial reconnaissance. Photogrammetry is also used to measure distances between objects, calculate the volume of a certain area, and create 3D models of objects, buildings, and landscapes.
By combining photographs taken from various angles, photogrammetry can create detailed 3D models of objects, buildings, and landscapes. These models can be used for various applications, such as urban planning, disaster management, crime scene analysis, and 3D printing. Photogrammetry can also be used to create virtual reality simulations for training and educational purposes.Photogrammetry is a versatile technology that can be used for many applications. It is an important tool for a variety of industries, including architecture, engineering.
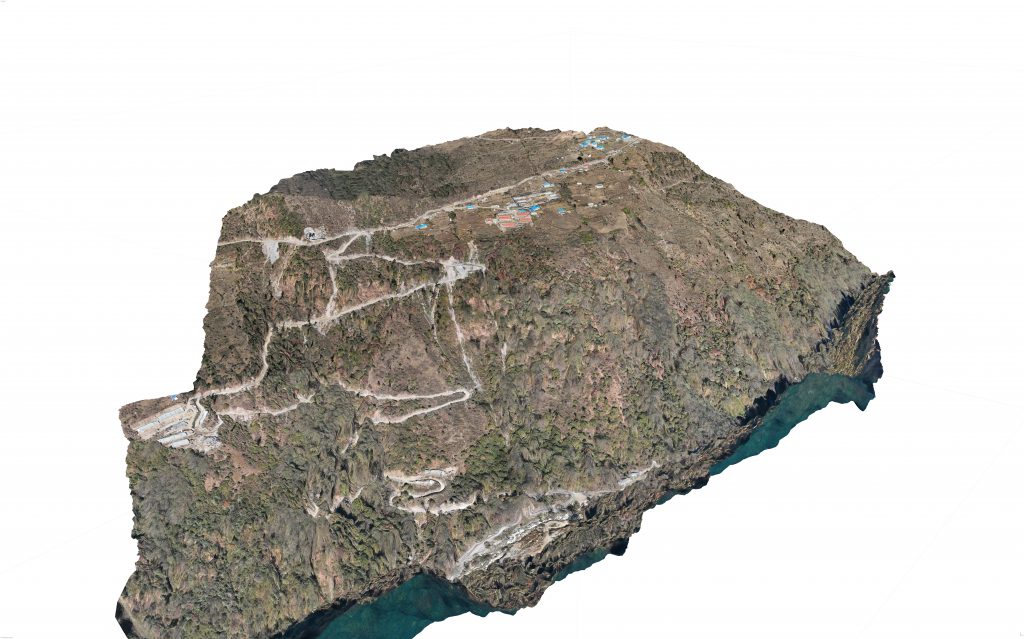
Here's a 3D model of my camp that i created using Photogrammetry.
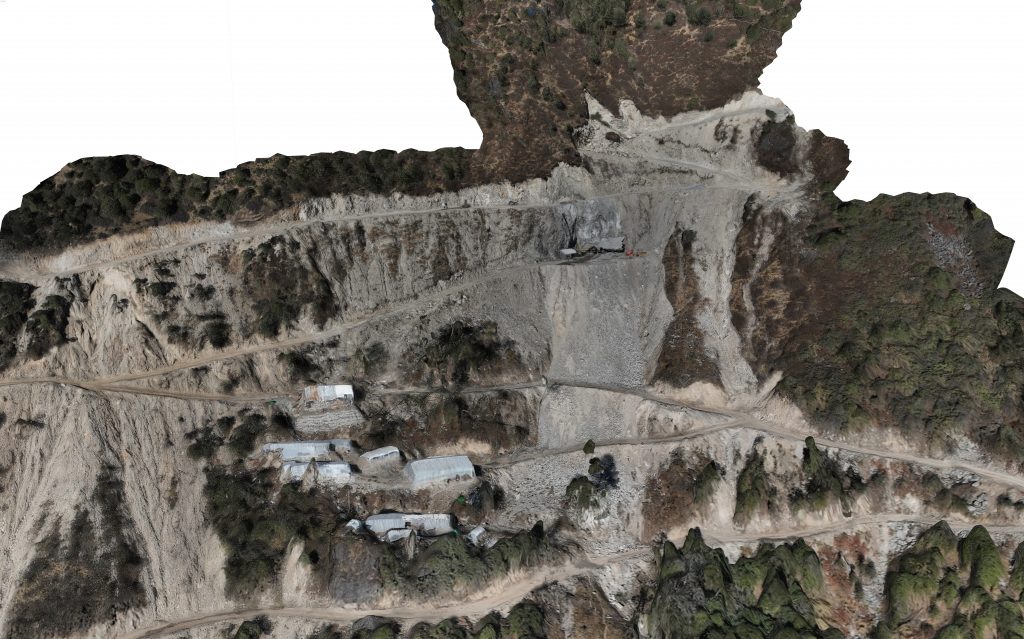
Also a 3D model of my Powerhouse site during my internship.
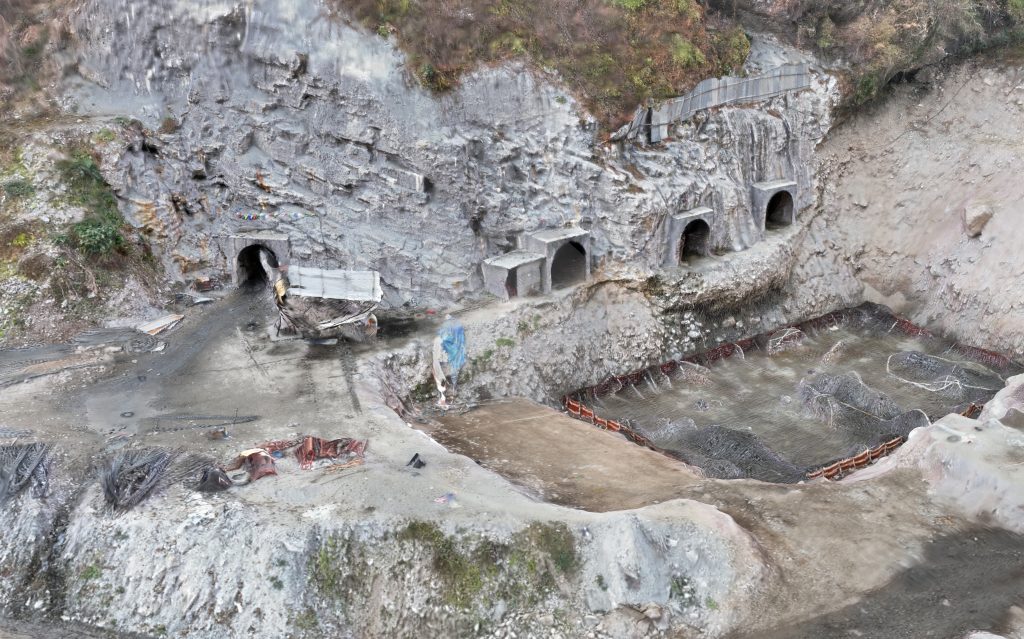
Also a 3D model of an outlet portal that i visited during my internship
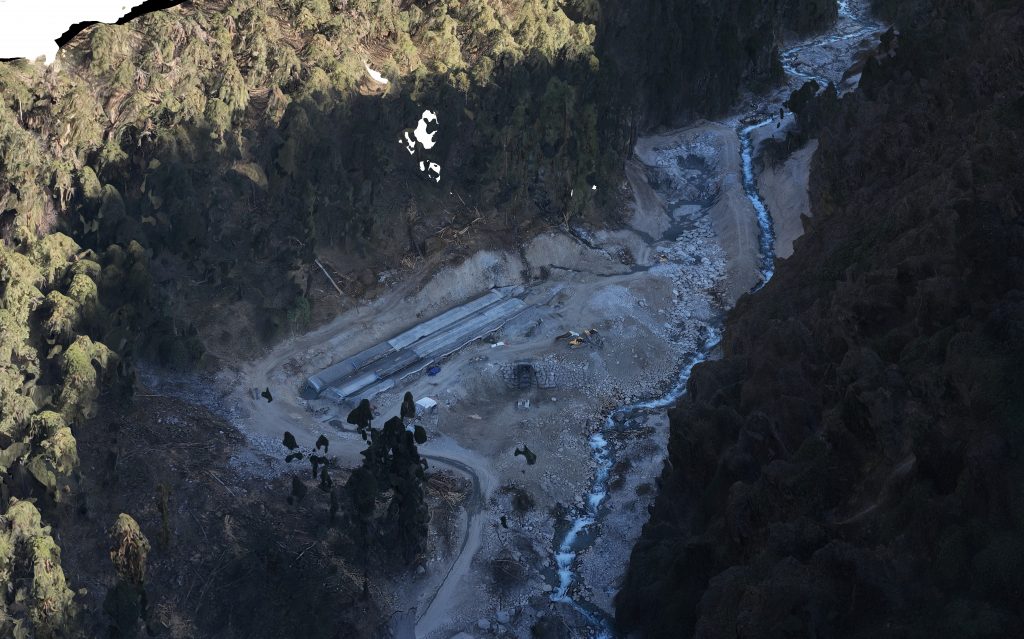
Another 3D model of Likhu headworks that I visited during my internship.
Photogrammetry might seem as a fun thing to do but it also has a very wide range of applications such as generation of contours for Surveying, measuring area and volume of any surface or objects, and inspection of different sites.
What are Contours?
Contours are an important line feature used in surveying and mapping to represent the shape and elevation of the land surface. Contours are used to show changes in elevation on a map, aerial photograph, or other surface representation. Contours are created by connecting points of equal elevation on a map or surface. Contour lines are usually labeled with their elevation, and they can be used to measure slope and distances. Contours are also used to calculate the volume of earth that needs to be moved in construction projects and to estimate the amount of runoff due to rainfall. Contours can also be used to identify potential sources of groundwater and to identify areas of higher erosion risk. Contours can also be used to interpret landscape features such as ridges, valleys, and watersheds.
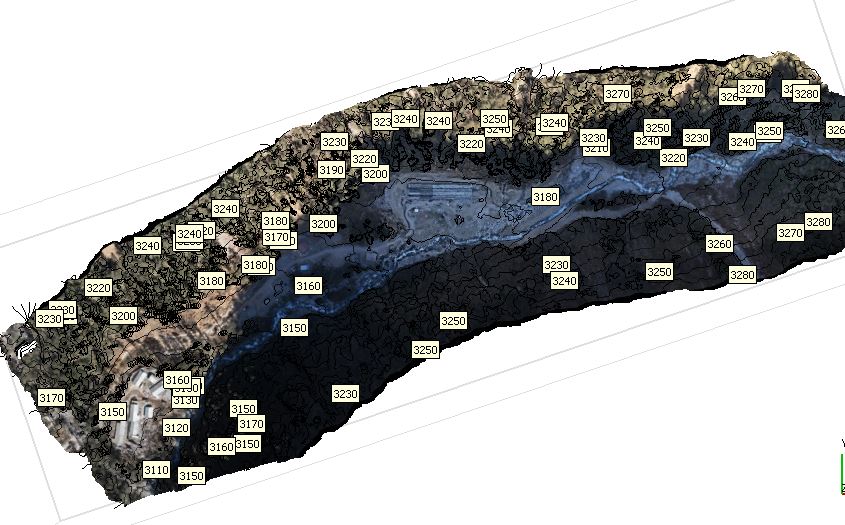
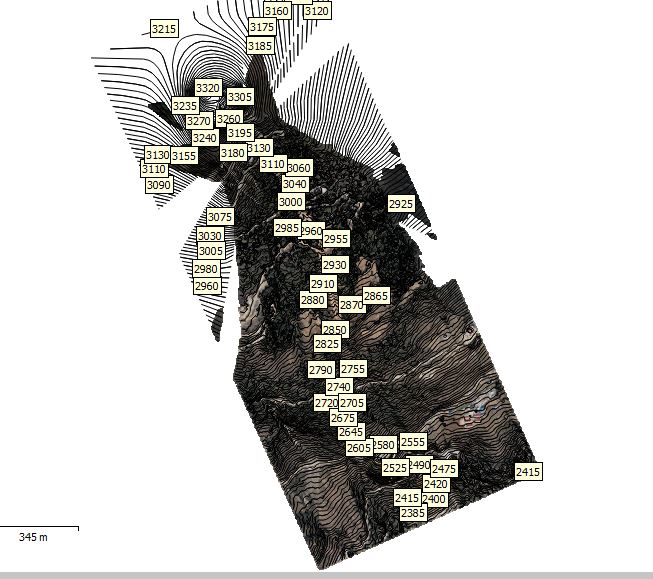
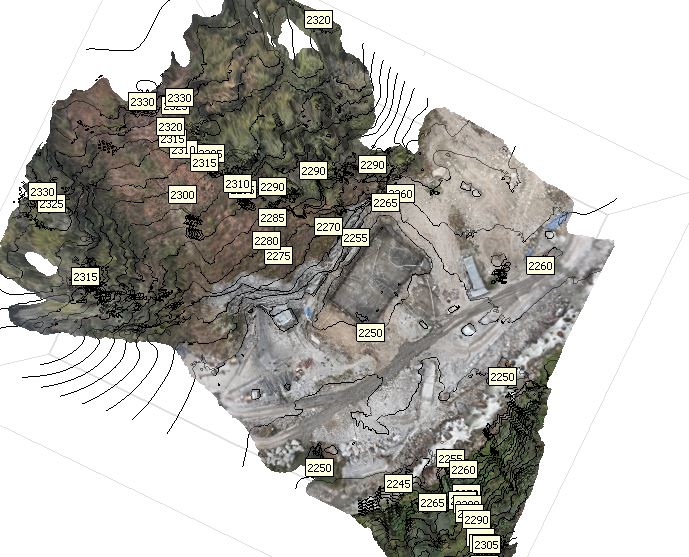
For referance here's a contour map that I created using the software Agisoft Metashape Pro.
Just a sample showing the contours of whole Nupche-Likhu Hydropower project
The contours might not be that accurate but can be used as a referance for further studies. For example as we can see the elevation 2250m is being shown constant in all of that area hence we know that this areas relatively on the same level.
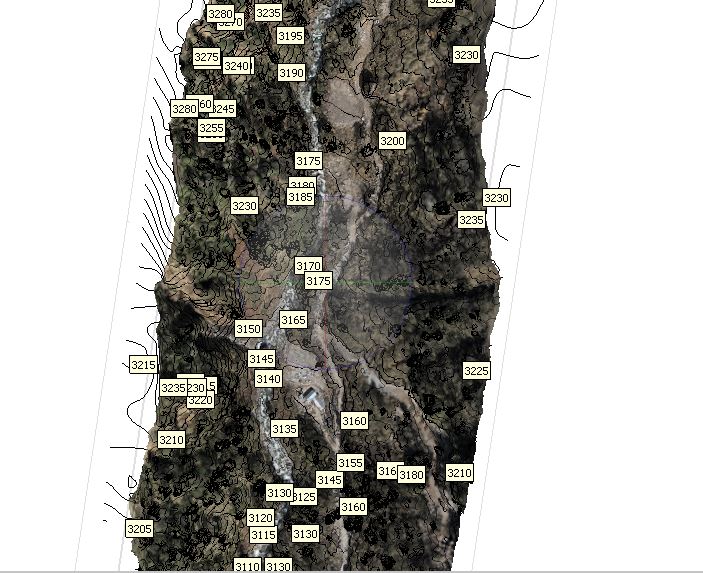
Also I generated contours of Nupche headworks during my internship there.
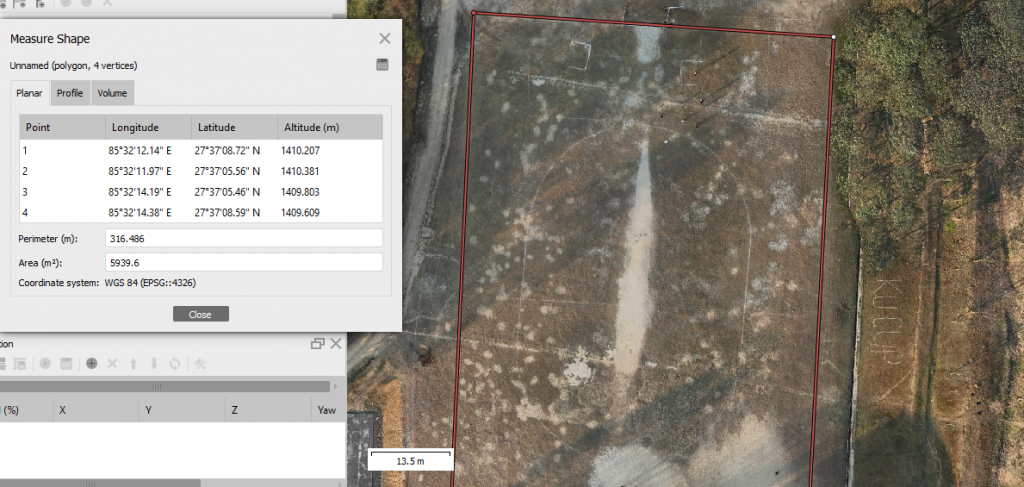
We can also use these models to find approximate Dimensions, Area & Volume of any surface, for my projects i personally use the software Agisoft Metashape pro for generation of these models.
Here, in this image we can see that area, perimeter, volume, etc are being displayed.